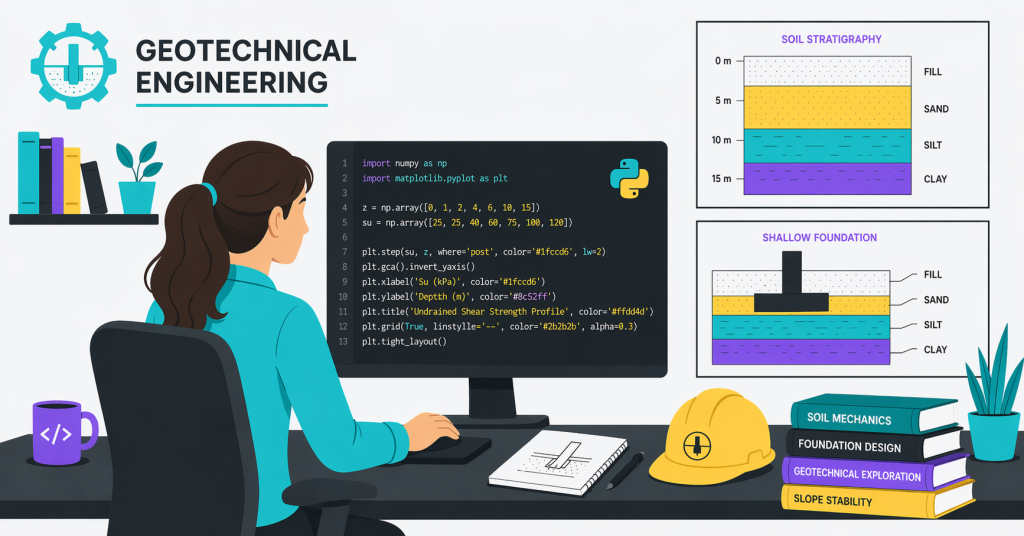
You have made the decision to start using Python. Now the obvious question is: where do you actually begin?
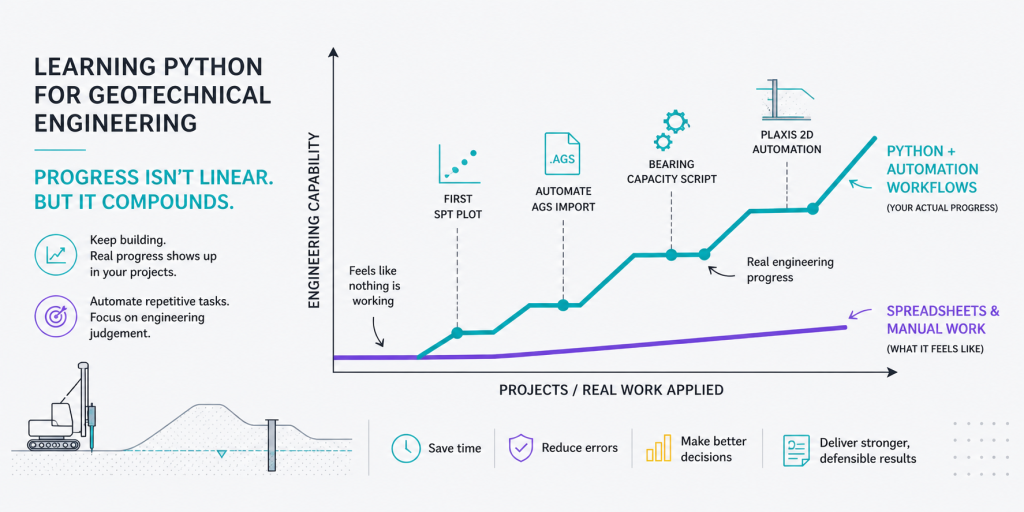
This guide gives you the complete answer: every library that matters for geotechnical engineering work, grouped by what it does, with honest advice on the tools and environments that will get you productive fastest.
In this post you will learn some Python libraries that cover the full range of geotechnical engineering tasks
Why the Right Libraries Matter From Day One
Python on its own is a programming language. The libraries are what turn it into a geotechnical engineering toolkit. Each library is a collection of pre-built functions written and tested by thousands of developers, functions that handle the heavy lifting so you can focus on the engineering.
Choosing the right libraries from the start means you build habits that scale. The same stack that handles your first shear strength profile will handle your hundredth borehole log, your CPT correlations, and your automated PDF reports. That is the goal: one set of tools, applied consistently, across your entire workflow.
Python Libaries for Geotechnical Engineering: Group One – The Scientific Core
These four libraries appear in almost every geotechnical Python script ever written. They are the foundation of everything else.
NumPy: The Engine for Numerical Work
NumPy provides fast, precise arithmetic on arrays of numbers. Apply a formula to every depth in a borehole log in a single line. Compute bearing capacity factors for 500 foundation scenarios in seconds. Generate evenly spaced depth arrays, apply trigonometric functions to friction angles, or work with matrices for stress analysis. NumPy handles all of it.
Think of it as Excel’s formula engine, but without the row limit and with complete control over every step of the calculation.
import numpy as np

# Depth array from 0 to 20 m at 0.25 m intervals
depth_m = np.arange(0, 20.25, 0.25)

# Apply a linear effective vertical stress profile
# Assumes bulk unit weight of 18 kN/m³, no water table for simplicity
unit_weight_kNm3 = 18.0
sigma_v_kPa = unit_weight_kNm3 * depth_m   # Effective vertical stress (kPa)

print(f"Stress at 5 m depth: {sigma_v_kPa[20]:.1f} kPa")
print(f"Stress at 10 m depth: {sigma_v_kPa[40]:.1f} kPa")
Pandas: Tables, Borehole Logs, and Data You Can Read
Pandas manages data in table form with rows and columns, exactly like a spreadsheet but programmable. Import a borehole log from Excel, filter by soil type, sort by depth, calculate SPT N-value corrections across every layer, and export the results back to Excel without opening a single file manually.
In practice, every module of geotechnical Python work eventually touches Pandas. It is where your field data lives in code.
import pandas as pd

# Build a soil profile table directly in Python
soil_profile = pd.DataFrame({
    "depth_top_m":    [0.0,  1.5,  4.0,  8.0],
    "depth_base_m":  [1.5,  4.0,  8.0, 14.0],
    "description":   ["Made ground", "Soft clay", "Firm clay", "Stiff clay"],
    "cu_kPa":        [None,  22,    45,    80],      # Undrained shear strength
    "spt_n_value":   [None, None,  None,  None]
})
Matplotlib: Plots That Look Like Engineering Outputs
Matplotlib produces publication-quality plots with full control over every element. Borehole logs drawn to scale, CPT profiles with dual axes, settlement time curves, stress path diagrams, load-settlement graphs for pile design, all achievable and all exportable as PDF, PNG, or SVG.
Your results stop living in a terminal and start looking like something a client can read.
import matplotlib.pyplot as plt
import numpy as np

depth_m = np.array([0, 1, 2, 3, 4, 5, 6, 7, 8, 9, 10])
cu_kPa  = np.array([20, 26, 33, 42, 53, 62, 70, 79, 86, 94, 102])

fig, ax = plt.subplots(figsize=(4, 8))
ax.plot(cu_kPa, depth_m, color="#1fccd6", linewidth=2, label="cᵤ profile")
ax.scatter(cu_kPa, depth_m, color="#8c52ff", s=50, zorder=5)
ax.invert_yaxis()
ax.set_xlabel("Undrained Shear Strength, cᵤ (kPa)")
ax.set_ylabel("Depth (m)")
ax.set_title("Shear Strength Profile — BH-01")
ax.grid(True, linestyle="--", alpha=0.4)
ax.legend()
plt.tight_layout()
plt.savefig("cu_profile_BH01.pdf")   # Save directly to PDF for your report
plt.show()
SciPy: Statistics, Interpolation, and Curve Fitting
SciPy builds on NumPy and adds the statistical and mathematical tools that geotechnical work regularly demands. Interpolate CPT sleeve friction values between measured depths. Fit a consolidation curve to settlement monitoring data. Run statistical correlations between SPT N-values and shear strength. Perform optimisation routines for back-analysis. SciPy covers all of this without requiring you to implement the underlying maths from scratch.
from scipy.interpolate import interp1d
import numpy as np

# Measured cone resistance from a CPT (at discrete depths)
measured_depth_m = np.array([0.5, 1.0, 2.0, 3.5, 5.0, 7.0, 9.0])
qc_MPa           = np.array([0.8, 1.2, 2.1, 3.4, 4.8, 6.1, 7.5])

# Build a continuous interpolation function
interpolate_qc = interp1d(measured_depth_m, qc_MPa, kind="linear")
Python Libaries for Geotechnical Engineering: Group Two – Smarter Output
Once you can run calculations and produce results, the next question is how those results leave Python. These libraries handle the output layer: formatted equations, professional PDF reports, interactive plots, and Excel files your client or checker can open.
SymPy: Equations That Look Like a Calculation Sheet
SymPy is a symbolic mathematics library. In a Jupyter Notebook or Google Colab, it renders equations in proper mathematical notation, the kind you would see in Eurocode 7 or a technical appendix.
Plotly: Interactive Plots for Data Exploration
Plotly produces interactive, browser-based charts. You can hover over data points, zoom into a specific depth range, and toggle soil layers on and off to explore your results.
og library, which is covered below. Learning Plotly early means you can take full advantage of purpose-built geotechnical tools as your skills grow.
ReportLab: Automated PDF Reports From Python
ReportLab generates professional PDF documents directly from Python. You can combine Pandas tables and Matplotlib plots into a formatted report complete with titles, headers, and page numbers, all produced automatically in a single script run.
OpenPyXL: Reading and Writing Excel Without Opening Excel
Most geotechnical data still lives in Excel. OpenPyXL lets Python read that data, process it, and write results back without you touching the file. Combined with Pandas, which uses OpenPyXL under the hood, this creates a seamless bridge between your existing data and a modern Python workflow. If your site investigation contractor delivers data in Excel, or your client expects results in a formatted spreadsheet, OpenPyXL is how you automate that handover.
Python Libaries for Geotechnical Engineering: Group Three – Geotechnical-Specific Libraries
Beyond the core and output layers, a growing set of purpose-built Python libraries handles calculations specific to geotechnical engineering. These are worth knowing, both for what they offer and for how they show you to structure auditable, repeatable code.
Groundhog: A General-Purpose Geotechnical Library
Groundhog is a Python package built specifically for automated geotechnical calculations. Its scope is wide: CPT data processing and soil classification, settlement and consolidation, earth pressure coefficients, liquefaction assessment, Eurocode 7 calculations, and constitutive model parameters, among others. It covers both onshore and offshore problems and is under active development.
pySlope: Slope Stability Analysis
pySlope is built for slope stability assessment using Bishop’s simplified method of slices. You define the slope geometry, soil layers with cohesion and friction angle, water table position, and any surcharge loads. The library computes the factor of safety and identifies the critical failure surface. For embankment design, cutting assessments, or rapid landslide screening, it gives you a scriptable and repeatable alternative to a graphical interface.
python-ags4: Reading AGS Ground Investigation Data
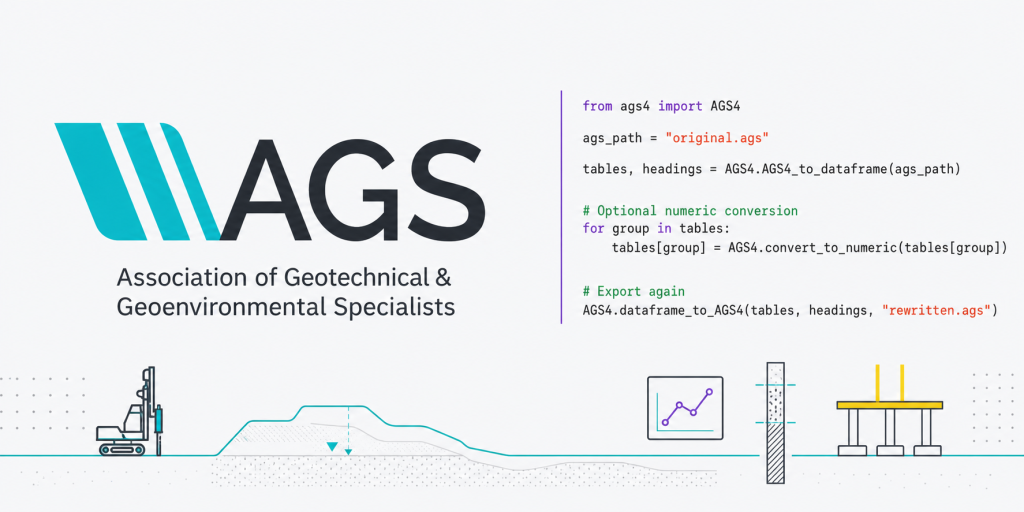
The AGS data format is the UK standard for transferring ground investigation data between organisations and software systems. When your site investigation contractor submits data, it almost certainly arrives as an AGS4 file. The python-ags4 library reads those files directly into Pandas DataFrames, so you can access laboratory results, in-situ test data, and sample records without any manual transcription.
This matters more than it might first appear. Manual data entry from AGS files is one of the most error-prone steps in the ground investigation workflow. Automating it removes the risk and recovers the time. If you want a deeper look at the AGS format and how to work with it in Python, this post covers everything you need to know.